The CBEI Emissions Profiling and Prioritization Tool (“CBEI Prioritization Tool”)is an Excel-based spreadsheet tool designed to facilitate city-scale climate action planning related to consumption-based emissions.
The tool can be used to:
- Enter consumption-based emissions inventory (CBEI) data in policy-relevant categories and subcategories
- Rank consumption categories according to different criteria related to policy goals (as outlined in the CBEI Policy Planning Guidebook)
- Identify and prioritize “mitigation behaviors”—consumer actions that could reduce emissions—associated with different kinds of consumption, as a basis for developing policy actions
The spreadsheet also includes:
- Examples of policy-relevant CBEI classifications, with “typical” city-level CBEI data for different regions of the world that can be modified and used in the tool
- Examples of mitigation behaviors relevant to different kinds of consumption
- Explanations of ranking and prioritization criteria

Using the prioritization tool
The CBEI Prioritization Tool has six main worksheets or “tabs”:
Introduction
Provides a short overview of the tool along with links to each main tab in the spreadsheet.
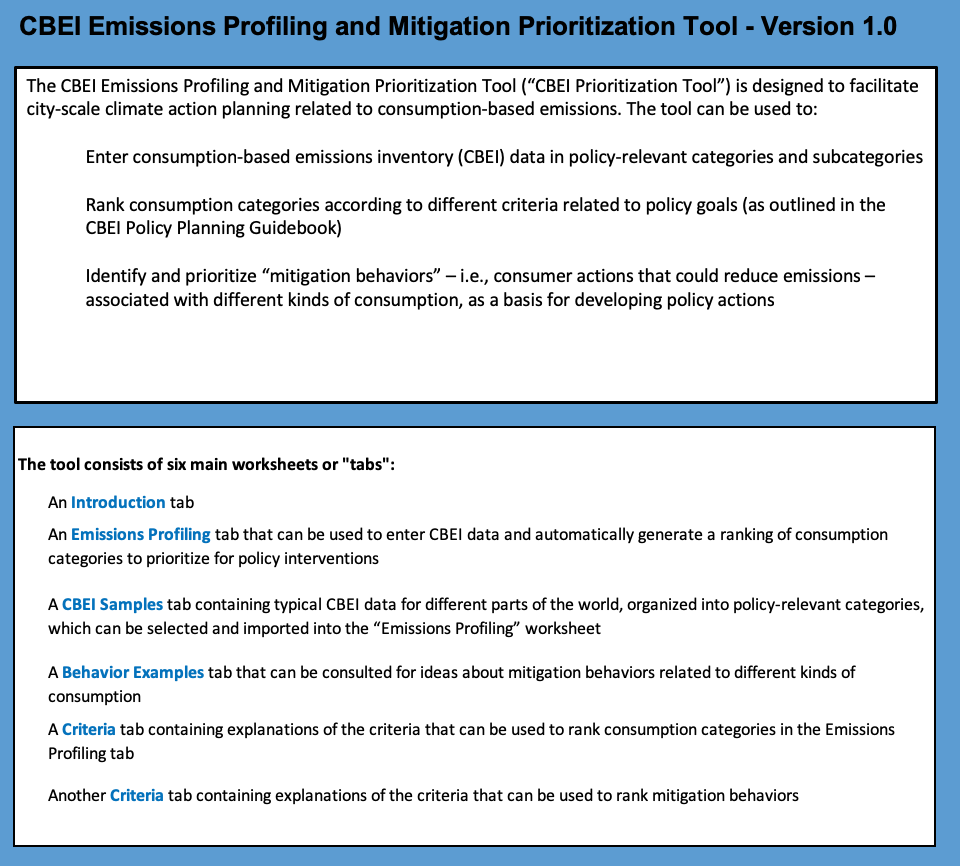
This is the “landing” page for the CBEI Prioritization Tool.
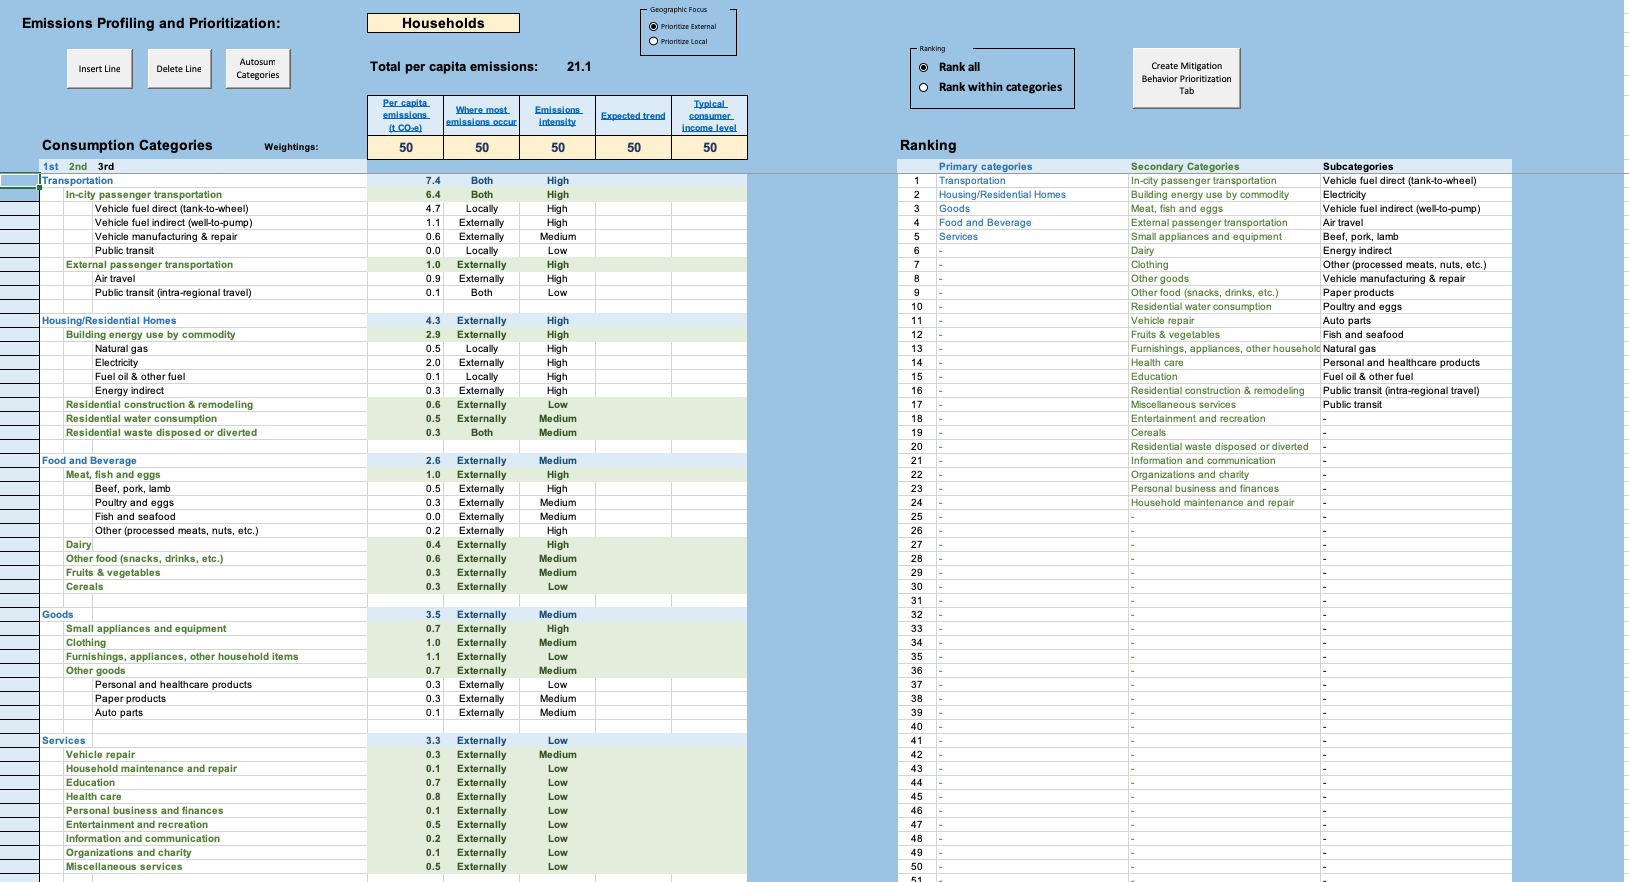
Emissions profiling
Enter CBEI data and automatically generate a ranking of consumption categories to prioritize for policy interventions
This worksheet can be used to:
- Enter consumption-based emissions inventory (CBEI) data in policy-relevant categories and subcategories
- Assign criteria ratings for each category of consumption
- Rank consumption categories according to the criteria, based on policy goals
- Create additional spreadsheet tabs for identifying and ranking “mitigation behaviors,” specific to different categories of consumption
Entering CBEI data
The tool is designed to be highly flexible with respect to how CBEI data are categorized and entered. By default, the tool assumes CBEI data will reflect household consumption. However, if you have a CBEI specific to government consumption, you can indicate this in the cell at the top of the worksheet (cell E2). (This setting is purely informational, and does not affect how the rest of the tool works.)
The Emissions Profiling worksheet can accommodate up to three “tiers” of categories and subcategories related to different types of consumption. Start by entering high level (tier 1) category names in the first column (spreadsheet column B), and then—as desired—provide secondary categories (tier 2) and subcategories (tier 3) in the adjacent columns (columns C and D). Be sure to enter category names on separate lines (the spreadsheet will warn you if you enter two category names on the same line). Per capita emissions associated with each category can be entered in column E.
It is not required to enter category names and data for every tier. If your CBEI breaks out data for only one or two levels of aggregation, category names and per capita emissions can be entered for those tiers, and the other tiers can be ignored.
Rows are automatically highlighted in different colors to differentiate entries (blue for tier 1, green for tier 2, and white for tier 3).
It is not necessary to put an entry on every row—skipping rows will not affect the results.
If, after making some entries, you decide you want to insert or delete a line, you can do this using the “Insert Line” and “Delete Line” buttons at the top of the worksheet. First, select a cell in column A and on the row where you want to insert or delete (i.e., one of the light-colored boxes on the left). Then click either the “Insert Line” or “Delete Line” button.
For an example of how data may be entered, see the CBEI Samples tab.
The spreadsheet can automatically sum per capita emissions associated with subcategories (tier 2 or 3) into higher categories. It will similarly convert criteria ratings for subcategories into weighted average criteria ratings for higher-level categories. To automatically sum the data you have entered and generated averaged criteria ratings, click on the “Autosum Categories” button at the top of the worksheet. For example, if you enter:
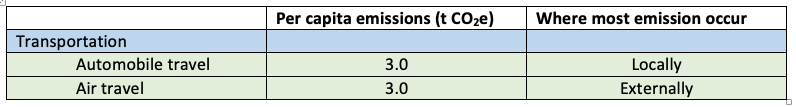
…clicking the “Autosum” button will automatically insert “6.0” tons for per capita emissions, and “Both” for “Where most emissions occur” (reflecting a blend of local and external emissions) in the blue “Transportation” row.
Assigning criteria ratings
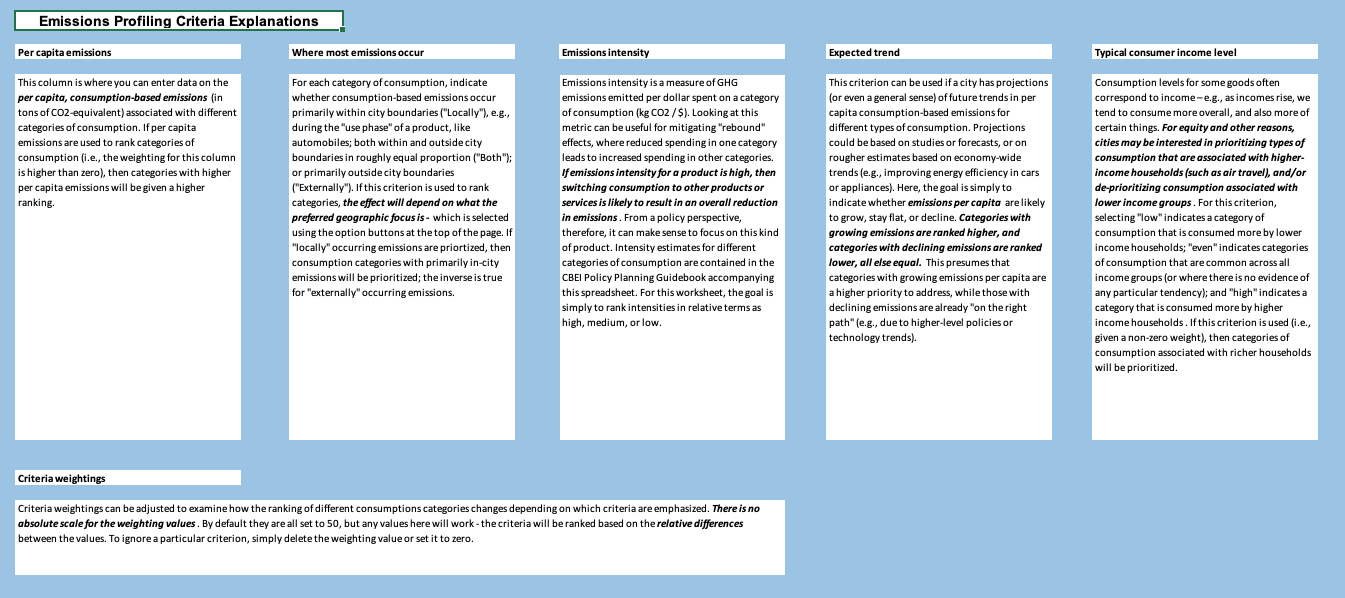
The Emissions Profiling worksheet allows consumption categories to be prioritized for policy action using up to five different criteria. For each category and subcategory of consumption, the user can select inputs for:
- Per capita emissions (in tons of CO2-equivalent)
- Where most emissions occur (locally, externally, or an even mix of both)
- Emissions intensity (high, medium, or low)
- Expected trends (growing, flat, or declining)
- Typical consumer income level (high, mixed, or low)
Explanations and guidance for these criteria are contained in the Criteria – Emissions Profiling tab. Click on the hyperlinked criteria name in the Emissions Profiling tab to jump to the explanations.
Use of the criteria is optional. It is not expected that users will have detailed data or justifications for all these criteria, for all categories and subcategories of consumption. If insufficient data are available, the criteria ratings can be left blank, or they can be filled in using a “best guess” (or a default “middle” rating) in order to see how priority rankings might change.
Ranking consumption categories
On the right side of the worksheet, consumption categories and subcategories are automatically ranked according to the emissions data and criteria ratings entered on the left side. The rankings depend on how different criteria are weighted (row 7, columns E through I).
Criteria weightings can be adjusted to examine how rankings change depending on which criteria are emphasized. There is no absolute scale for the weighting values. By default they are all set to “50” (assuming a scale of 1 to 100), but any values here will work - the criteria will be ranked based on the relative differences between the values. To ignore a particular criterion, simply delete the weighting value or set it to zero.
At the top of the page is a box labeled “Geographic Focus” with two radio buttons: “Prioritize External” and “Prioritize Local.” Selecting a radio button will determine how the criteria entries for “Where most emissions occur” are used. If “Prioritize External” is selected, then consumption categories whose emissions occur primarily externally (outside city boundaries) will be given a higher ranking. The reverse is true if “Prioritize Local” is selected.
Above the “Ranking” window on the right is another box with two radio buttons. Choosing “Rank All” will show the relative rankings of all categories and subcategories within the same tiers. Choosing “Rank within categories” will display priority rankings organized by tier.
Creating a new “mitigation behaviors prioritization” tab
Once consumption categories from a CBEI have been ranked and prioritized, you can use the CBEI Prioritization Tool to identify and rank mitigation behaviors associated with specific kinds of consumption. Start by selecting a category in the “Ranking” list. Any category in any tier can be selected for this purpose. It can be useful, for example, to think about mitigation behaviors specific to individual subcategories, as well as cross-cutting behaviors that may be relevant to an entire (tier 1 or tier 2) category of consumption. Separate sheets can be created for each of these purposes.
Next, click on the “Create Mitigation Behavior Prioritization Tab” button at the top of the worksheet. A new tab will be automatically generated with a name corresponding to the category you selected (if the name is a duplicate or contains characters disallowed by Excel, you will be prompted to enter an alternate name.) The new tab will be colored to distinguish it from other spreadsheet tabs – blue for tier 1 categories, green for tier 2 categories, and black for tier 3 subcategories.
CBEI samples
Contains typical CBEI data for different parts of the world, organized into policy-relevant categories, which can be selected and imported into the “Emissions Profiling” worksheet
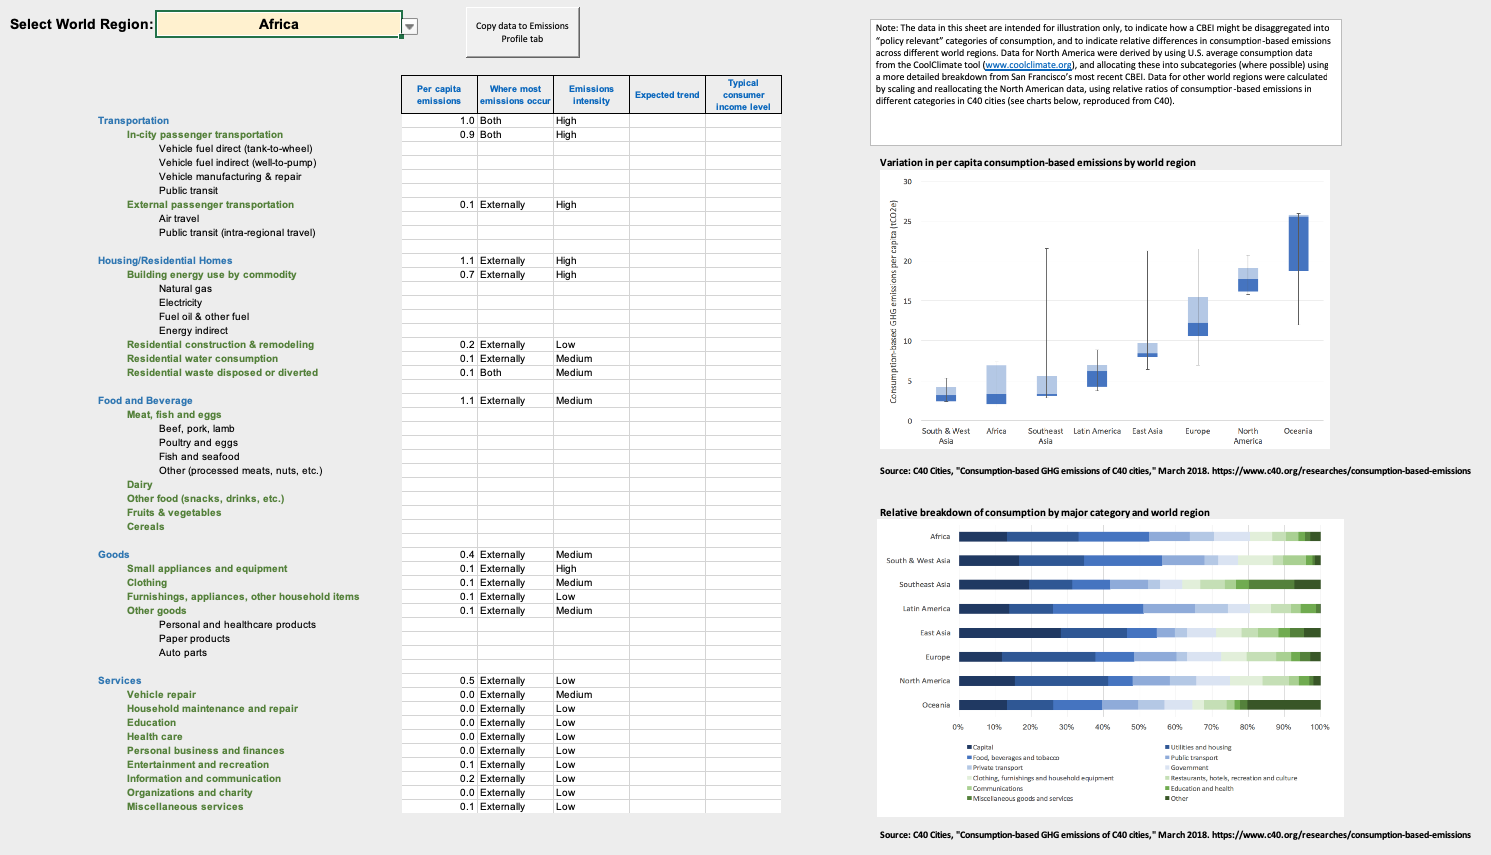
On this tab you can see an example of a “policy relevant” categorization of CBEI emissions—i.e., consumption-based emissions disaggregated into categories relevant for identifying common mitigation behaviors and policy interventions. This is only one example. Different cities may wish to break down and organize emissions using different consumption categories and subcategories.
This worksheet also contains sample CBEI data mapped to each category for different regions of the world, selectable from a dropdown menu at the top of the page. For regions outside North America, data are only entered for higher levels of aggregation in most cases (e.g., total building energy use, but not broken out by fuel type, which varies from region to region).
For all regions, the data in are intended for illustration only, to indicate how a CBEI might be disaggregated into “policy relevant” categories of consumption, and to indicate relative differences in consumption-based emissions across different world regions. They may be a useful starting point for cities without their own detailed CBEIs, but should be replaced with more accurate data where possible.
Data for North America were derived by using U.S. average consumption data from the CoolClimate tool, and allocating these into subcategories (where possible) using a more detailed breakdown from San Francisco’s most recent CBEI. Data for other world regions were calculated by scaling and reallocating the North American data, using relative ratios of consumption-based emissions in different categories in C40 cities (see charts below, reproduced from C40).
Behavior examples
Consult for ideas about mitigation behaviors related to different kinds of consumption
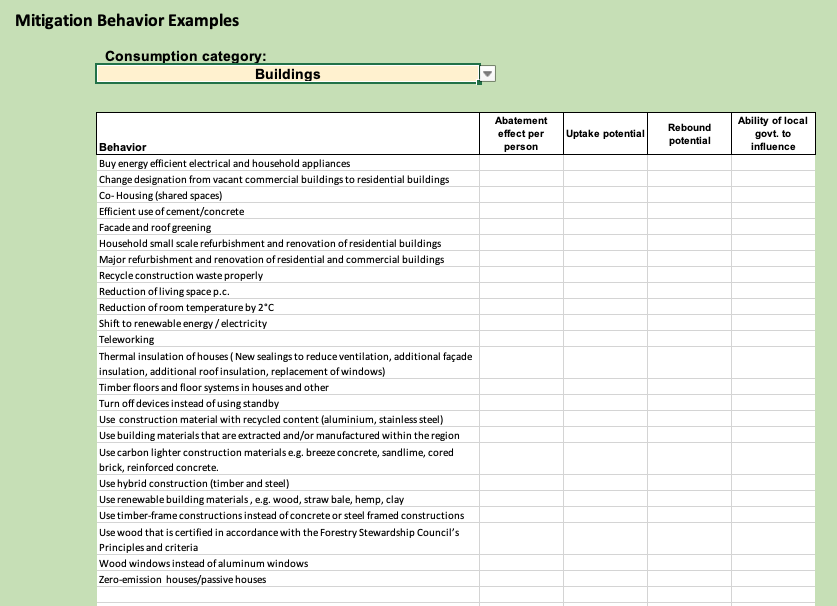
This tab provides an easy way to look up possible mitigation behaviors, as inspiration for filling out Mitigation Behavior Prioritization tabs for different categories of consumption. Lists can be generated for different consumption categories, selectable using the dropdown menu at the top of the page. The lists of possible behaviors are taken from a recent study[1] and are thorough but should not be considered comprehensive. Cities using this tool may be able to identify many other behavior changes relevant to their residents’ consumption as well.
Criteria tabs
Explanations of the criteria that can be used to rank consumption categories in the Emissions Profiling tab
There are two tabs in the spreadsheet containing explanations and guidance for the criteria used to rank consumption categories and mitigation behaviors, respectively. These tabs can be accessed directly, or by clicking on the criteria names in the Emissions Profile tab or a user-created Mitigation Behavior Prioritization tab.
Mitigation behaviors
List and prioritize consumer behaviors that could reduce emissions associated with the selected category of consumption
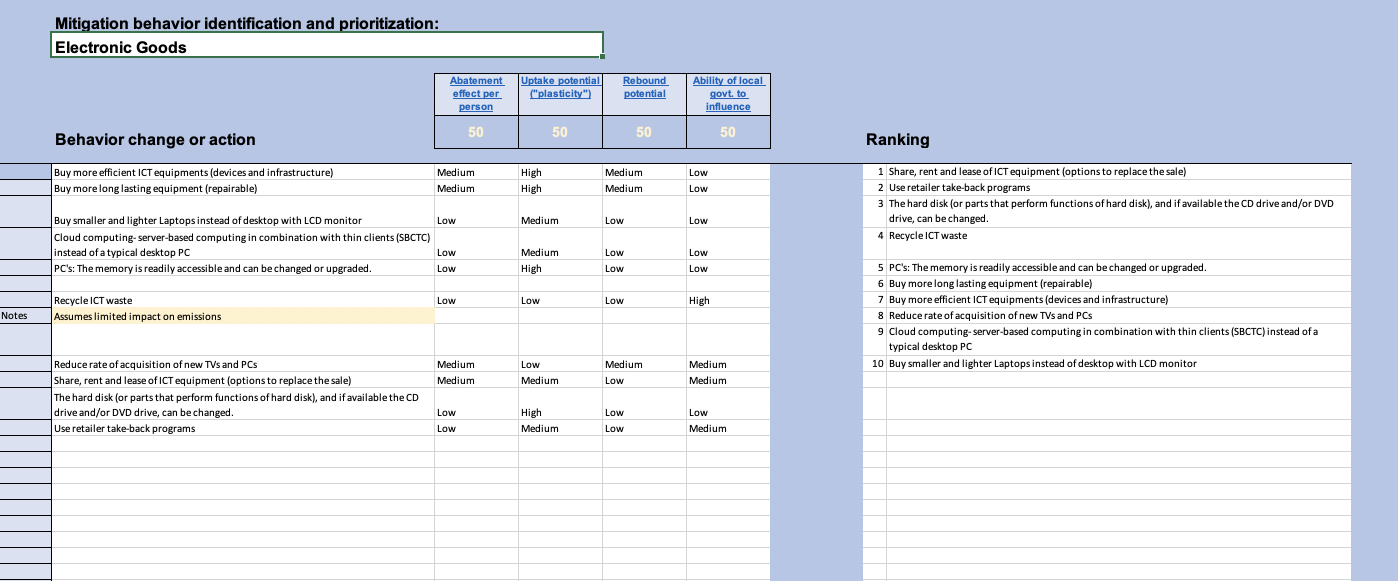
Each “mitigation behavior prioritization” tab – which will be named for a consumption category selected in the Emissions Profiling tab – can be used to list and prioritize consumer behaviors that could reduce emissions associated with the selected category of consumption.
As with the Emissions Profiling tab, this worksheet is designed to be flexible with respect to how behaviors are identified, entered, and rated. Start by entering a name or label for each behavior in column C, then—as desired—rate the behaviors against each of the four criteria to the right.
To aid with identifying possible behaviors, examples are provided in a separate Behavior Examples tab, organized by different consumption categories. However, anything can be entered into the rows on a mitigation behaviors tab.
Ratings will often depend on certain assumptions about a behavior and how it is performed, such as how often a typical person would engage in it (e.g., taking public transit) and/or the extent of its impact (e.g., average energy savings from new appliances or equipment). To document assumptions, notes can be added in the rows beneath an entry. To designate a row for entering notes, click on a cell in column A and choose “Notes” from the dropdown menu that appears. The entry cell for that row will be highlighted in yellow, indicating it is for documentation only, and the row will be ignored for the purpose of ranking mitigation behaviors.
It is not necessary to have an entry on every row—rows can be skipped or left blank, as desired, and this will not affect rankings. As on the Emissions Profiling tab, new lines can be added or deleted by clicking on a cell in column A and then clicking on either the “Insert Line” or “Delete Line” buttons, accordingly.
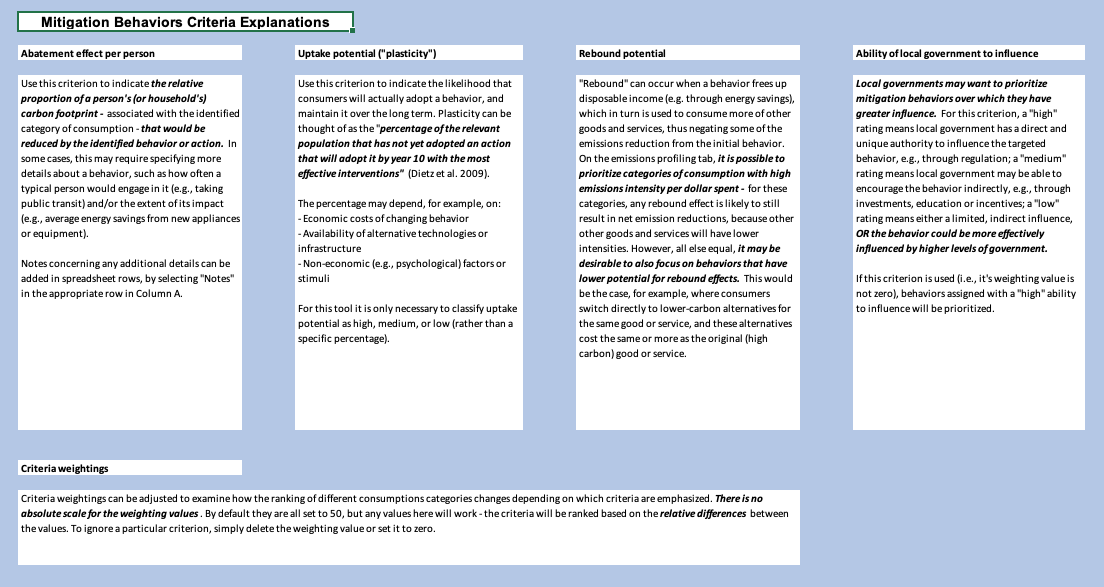
Each Mitigation Behaviors worksheet allows behaviors to be prioritized (for targeting with policy actions) using up to four different criteria. For each behavior, the user can select inputs for:
- Abatement effect per person
- Uptake potential (or “behavioral plasticity”)
- Rebound potential
- The ability of local government to influence the behavior
All criteria may be rated as low, medium, or high. Explanations and guidance for these criteria are contained in the Criteria – Mitigation Behaviors tab. Click on the hyperlinked criteria names to jump to these explanations.
As with emissions profiling, use of these criteria is optional. It is not expected that users will have detailed data or justifications for all the criteria. If insufficient data are available, the criteria ratings can be left blank, or they can be filled in using a “best guess” (or a default “medium” rating) in order to see how priority rankings might change.
On the right side of the worksheet, mitigation behaviors are automatically ranked according to the criteria ratings entered on the left side. The rankings depend on how different criteria are weighted (row 6, columns D through G). Criteria weightings can be adjusted to examine how rankings change depending on which criteria are emphasized. There is no absolute scale for the weighting values. By default they are all set to “50” (assuming a scale of 1 to 100), but any values here will work - the criteria will be ranked based on the relative differences between the values. To ignore a particular criterion, simply delete the weighting value or set it to zero.
- Moran, D., Wood, R., Hertwich, E., Mattson, K., Rodriguez, J. F. D., Schanes, K. and Barrett, J. (2018). Supplementary Information for: Quantifying the potential for consumer-oriented policy to reduce European and foreign carbon emissions. Climate Policy (Advanced online).